Creating Static Maps with Azure Maps
|
Oct 22 |
In this article, I will show you how to create a static map using Azure Maps. Unlike many of the partial examples on the Azure Maps sites, this is a fully functional map featuring custom icons, labels, zoom, and map type controls that you can embed into a web page. This article assumes that you already have an Azure Maps API key.
Table of Contents
- Working Example
- Load the Azure Maps Map Control and CSS Files
- CSS
- JavaScript
- The GetMap JavaScript Function
- Set the Latitude and Longitude
- Initialize the Azure Map and Pass in the Azure Map API Key
- Use the Azure Maps Ready Event Before Loading Datasources, Layers, and Assets
- Create a Reference to a Custom HTML Marker
- Create the Azure Map Datasource, Layer and the Point
- Create the Zoom Control
- Create a Map Style Control
- Create the Custom HTML Marker and Labels
- HTML Body
- Full Code
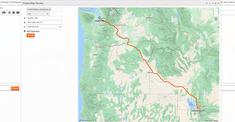
Working Example
Click on the button below to see a full working example of this code.
Load the Azure Maps Map Control and CSS Files
Load the required CSS first within the head section of the page. The CSS should be loaded prior to loading the JavaScript controller and the script can be loaded anywhere before the closing body of the page.
<!-- Add references to the Azure Maps Map control JavaScript and CSS files. -->
<link rel="stylesheet" href="https://atlas.microsoft.com/sdk/javascript/mapcontrol/3/atlas.min.css" type="text/css">
<script src="https://atlas.microsoft.com/sdk/javascript/mapcontrol/3/atlas.min.js">
CSS
CSS is used to style the map container. If you omit the CSS stylesheet, the Azure Map may be empty and not displayed. Here we simply set the body to consume 100% of the page.
<style>
	html,
	body {
		width: 100%;
		height: 100%;
		padding: 0;
		margin: 0;
	}

	#staticMap {
		width: 100%;
		height: 100%;
	}
</style>
JavaScript
The GetMap JavaScript Function
The following getMap() JavaScript function is needed to determine how the map will be rendered on the page. You can name the function anything you want, but it needs to be invoked on the HTML page. If you want to load multiple Azure Maps on a page, each map has to have a unique GetMap function name (i.e., getMap1(), getMap2(), etc).
function getMap() {Set the Latitude and Longitude
For readability, I typically query a database and set the latitude and longitude values as separate variables at the top of the JavaScript function. It should be noted that Azure Maps uses longitude, latitude, the GeoJSON standard, to represent geographical coordinates, whereas Bing Maps reverses the coordinates and uses latitude and longitude. I set these coordinates independently to figure out better what is going on.
// Set the necessary values from the database
var lon = 2.2945;
var lat = 48.8583;
Initialize the Azure Map and Pass in the Azure Map API Key
In the first line of the initialization logic, you need to specify the div ID that contains the map. In this example, I use 'staticMap'. The center attribute uses the longitude and latitude values to initially center the map on the page. I personally use the JavaScript Number function to ensure that the value is numeric.
The zoom setting determines how close the map will appear. Zoom requires a numeric value between 0 and 25. The higher the number, the closer the zoom- a zoom level of 0 renders the entire world in one tile.
You can also use the setCamera function to center the map with a bounding box, but I find it easier to use the center and zoom instead of calculating the bounding coordinates.
The view: 'Auto' setting determines the region based upon the user's IP address and renders the map according to local laws and map conventions. You can change this from auto and specify a given region using ISO 3166-1 alpha-2 codes, but I have never used this, and it's best to keep the setting at auto.
In my example, the authentication options interface (authOptions) requires your primary or secondary Azure Maps subscription key.
// Initialize a map instance.
map = new atlas.Map('staticMap', {
center: [Number(lon),Number(lat)],// Use the number function to ensure that the coordinates are numeric!
	zoom: 12,
	view: 'Auto',
	authOptions: {
			authType: 'subscriptionKey',
			subscriptionKey: 'YourPersonalAzureAPISubscriptionKey'
		}
});
Use the Azure Maps Ready Event Before Loading Datasources, Layers, and Assets
Azure map datasources and assets should always be loaded after using the Azure Maps ready event. This event fires as soon as the map is ready to be interacted with programmatically. Other map events can be loaded to the map using the map.events.add() method.
map.events.add('ready', function () {
	// Map Datasources and assets can now be safely loaded...
})//map.events
Create a Reference to a Custom HTML Marker
Use the imageSprite add method to add a custom marker. This method returns a Promise object and uses the then method to ensure that the image is loaded before placing it on the map as I do below. In the second argument in this example, I am using a custom map marker button (mapMarkerButton.gif) that I created with Illustrator. Replace this string with a URL of a custom marker of your own.
map.imageSprite.add('map-marker', '/blog/images/mapMarkers/mapMarkerButton.gif').then(function () {Create the Azure Map Datasource, Layer, and the Point
After the then method, we initialize the datasource, add a new map layer, apply the clear method to remove prior data within the datasource, and use the longitude and latitude coordinates to create a point within the new map layer.
// Create a data source to store the data in.
datasource = new atlas.source.DataSource();
// Add the datasource
map.sources.add(datasource);
// Add a layer for rendering point data.
map.layers.add(new atlas.layer.SymbolLayer(datasource));
// Remove any previous added data from the map.
datasource.clear();
// Create a point feature to mark the selected location.
datasource.add(new atlas.data.Feature(new atlas.data.Point([lon,lat])));
Create the Zoom Control
There are a multitude of optional map controls available. In my maps, I use a simple zoom control to allow the users to zoom into the map and float the control at the top right part of the page. You can also use top-left, bottom-right, and bottom-left to place any of the page controls. You can choose a light or dark picker style.
// Create a zoom control.
map.controls.add(new atlas.control.ZoomControl({
	zoomDelta: parseFloat(1),
	style: "light"
}), {
	position: 'top-right'
});
Create a Map Style Control
The Azure Map style control is an attractive, compact widget that allows users to change the map style. You can edit the available map styles. The control can use either a list, which displays the map styles like a traditional dropdown, or icons, as I have done here. Like the zoom control, you can position this on the map.
// Create the style control
map.controls.add(new atlas.control.StyleControl({
	mapStyles: ['road', 'grayscale_dark', 'night', 'road_shaded_relief', 'satellite', 'satellite_road_labels'],
	layout: 'icons'
}), {
	position: 'top-right'
});
Create the Custom HTML Marker and Labels
Here we are placing the custom HTML marker that was added to the map above (using the 'map-marker' ID). There are many options available to style this using the iconOptions interface; however, in this example, I am simply reducing the size of the custom marker by half using the scale attribute of .5.
The textOptions interface allows us to create custom labels on the map. Here, I specify the text that is shown, offset the label below the map point, and specify white text with a blurred emerald green shadow dropdown effect. This is one area where you should definitely explore if you want a custom label.
// Add the custom marker and label.
map.layers.add(new atlas.layer.SymbolLayer(datasource, null, {
	iconOptions: {
		// Pass in the id of the custom icon that was loaded into the map resources.
		image: 'map-marker',
		// Scale the size of the icon.
		size: 0.5
	},
	textOptions: {
		// Label
		textField: 'Eiffel Tower, Paris, France',
		size: 24,
		offset: [0, 2],// This controls the offset of the title (i.e. 'Zion National Park')
		color: '#FFFFFF', // Set the title text color to white
		haloColor: '#18392B', // Create a emerald green dropshadow effect
		haloWidth: 2,// The halo must have a width in order to be displayed
		haloBlur: 3//Blur the shadow
	}
}));//map.layers...
HTML Body
In the HTML body, call the getMap function to load the Azure Map to the page.
<!-- Load the map using the body -->
<body onload="getMap()">
	<div id="staticMap"></div>
</body>
Full Code
<!DOCTYPE html>
<html lang="en">
<head>
	<title>Static Azure Map Example</title>

	<style>
        html,
        body {
            width: 100%;
            height: 100%;
            padding: 0;
            margin: 0;
        }

        #staticMap {
            width: 100%;
            height: 100%;
        }
    </style>
</head>

<!-- Add references to the Azure Maps Map control JavaScript and CSS files. -->
<link rel="stylesheet" href="https://atlas.microsoft.com/sdk/javascript/mapcontrol/3/atlas.min.css" type="text/css">
<script src="https://atlas.microsoft.com/sdk/javascript/mapcontrol/3/atlas.min.js">

<script language="javascript">

	function getMap() {

		// Set the necessary values from the database
		var lon = 2.2945;
		var lat = 48.8583;

		// Initialize a map instance.
		map = new atlas.Map('staticMap', {
		center: [Number(lon),Number(lat)],// Use the number function to ensure that the coordinates are numeric!
			zoom: 12,
			view: 'Auto',
			authOptions: {
				 authType: 'subscriptionKey',
				 subscriptionKey: 'AzureMapSubscriptionKey'
			 }
		});//map...

		// Wait until the map resources are ready.
		map.events.add('ready', function () {
			// Load the custom image icon into the map resources. This must be done immediately after the ready event
			map.imageSprite.add('map-marker', '/blog/images/mapMarkers/mapMarkerButton.gif').then(function () {
				// Create a data source to store the data in.
				datasource = new atlas.source.DataSource();
				// Add the datasource
				map.sources.add(datasource);
				// Add a layer for rendering point data.
				map.layers.add(new atlas.layer.SymbolLayer(datasource));
				// Remove any previous added data from the map.
				datasource.clear();
				// Create a point feature to mark the selected location.
				datasource.add(new atlas.data.Feature(new atlas.data.Point([lon,lat])));

				// Add the controls --------------------------------------------
				// Create a zoom control.
				map.controls.add(new atlas.control.ZoomControl({
					zoomDelta: parseFloat(1),
					style: "light"
			   }), {
				  position: 'top-right'
				});

				// Create the style control
				map.controls.add(new atlas.control.StyleControl({
				  mapStyles: ['road', 'grayscale_dark', 'night', 'road_shaded_relief', 'satellite', 'satellite_road_labels'],
				  layout: 'icons'
				}), {
				  position: 'top-right'
				});

				// Add the custom marker and label.
				map.layers.add(new atlas.layer.SymbolLayer(datasource, null, {
					iconOptions: {
						// Pass in the id of the custom icon that was loaded into the map resources above (map.imageSprite.add())...
						image: 'map-marker',
						// Scale the size of the icon.
						size: 0.5
					},//iconOptions:
					textOptions: {
						// Label
						textField: 'Eiffel Tower, Paris, France',
						size: 24,
						offset: [0, 2],// This controls the offset of the title (i.e. 'Eiffel Tower, Paris, France')
						color: '#FFFFFF', // Set the title text color to white
						haloColor: '#18392B', // Set the title background text color to emerald green
						haloWidth: 2,// The halo must have a width in order to be displayed
						haloBlur: 3//This is similiar to a drop shadow with blur
					}//textOptions:...

				}));//map.layers...

			});//map.imageSprite.add...

		})//map.events

	}//getMap


<!-- Load the map using the body -->
<body onload="getMap()">
	<div id="staticMap"></div>
</body>
Related Blogs
Tags
Azure Maps
|
|
|
|
Hi, my name is Gregory! I have several degrees in computer graphics and multimedia authoring, and I have been developing enterprise web applications for the last 25 years. I love web technologies and the outdoors and am passionate about giving back to the community. |
|
This entry was posted on October 16, 2025 at 6:19 PM and has received 1898 views.
Comments
There are 0 comments.